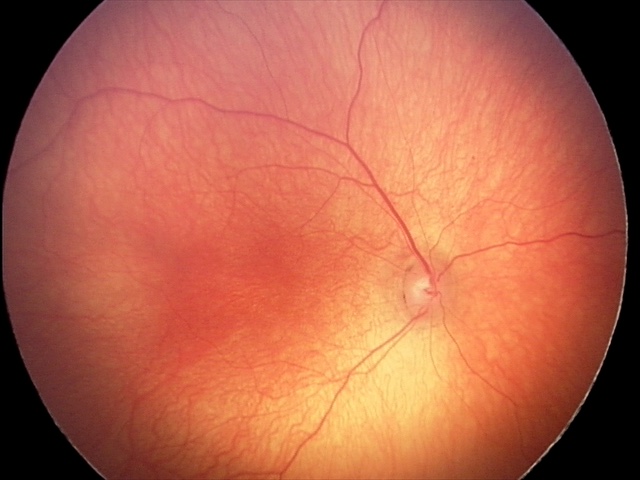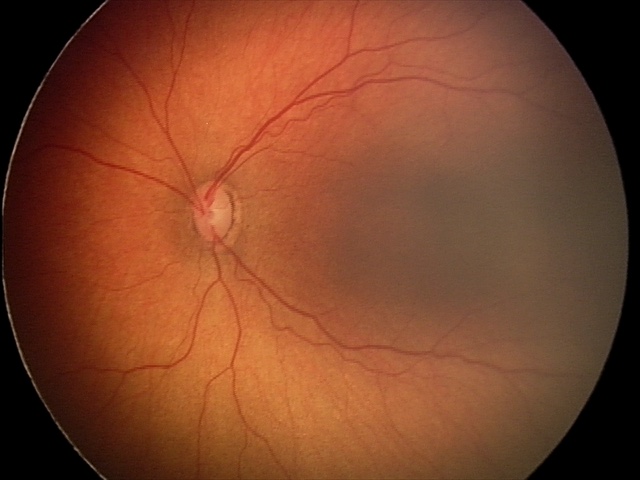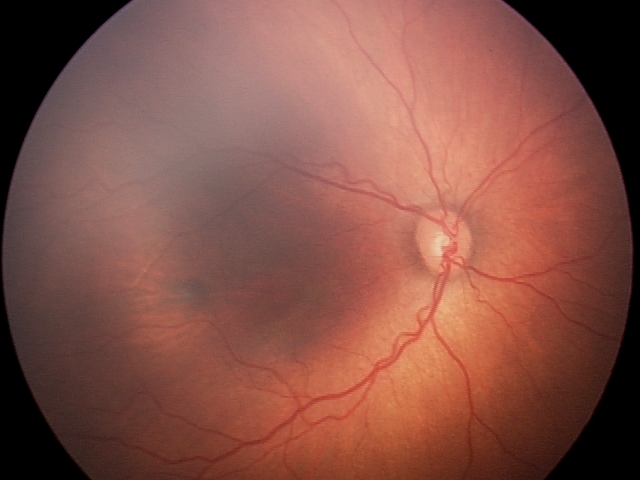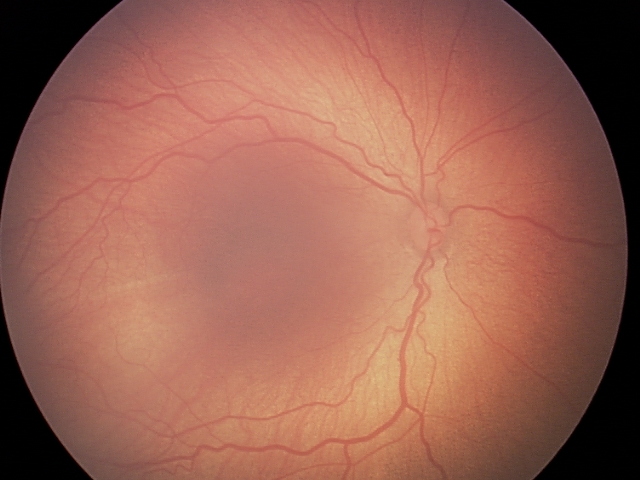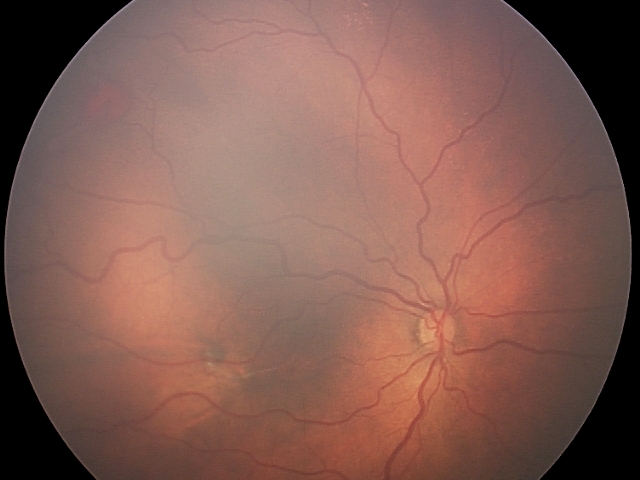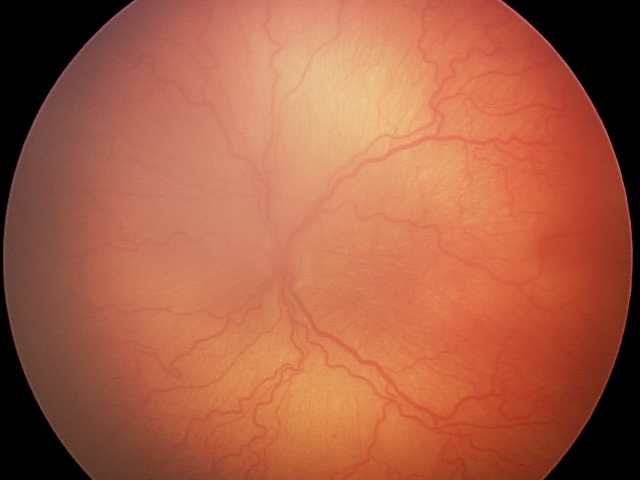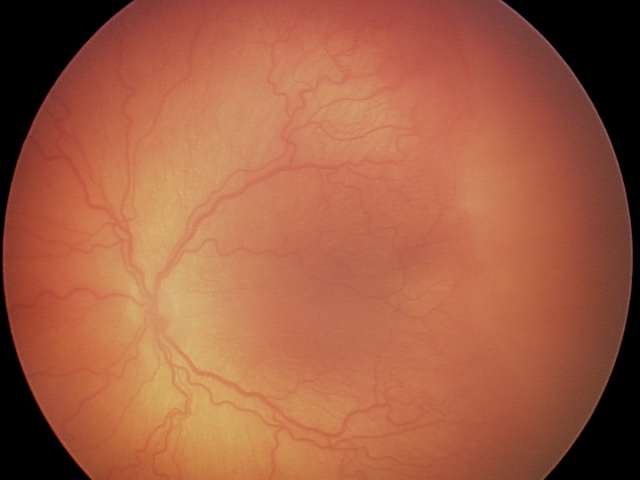
The i-ROP severity score (1-9) represents a continuous range of vascular abnormality. The 9 representative retinal images are shown here, in order of increasing disease severity, based on diagnostic classification of rankings by 8 experts as referenced in this study. Future work will integrate computer-based image analysis methods.
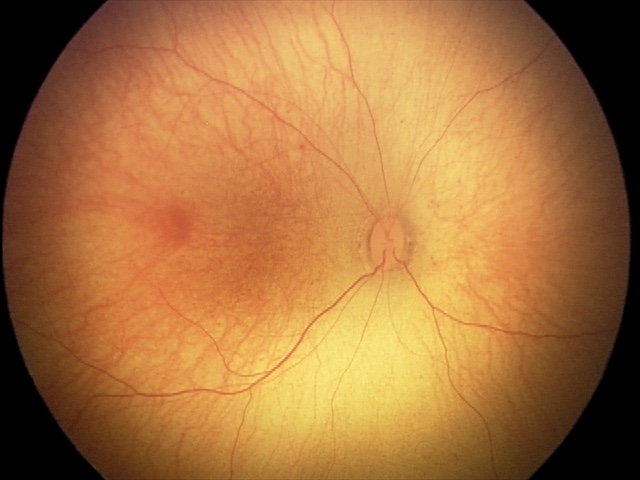
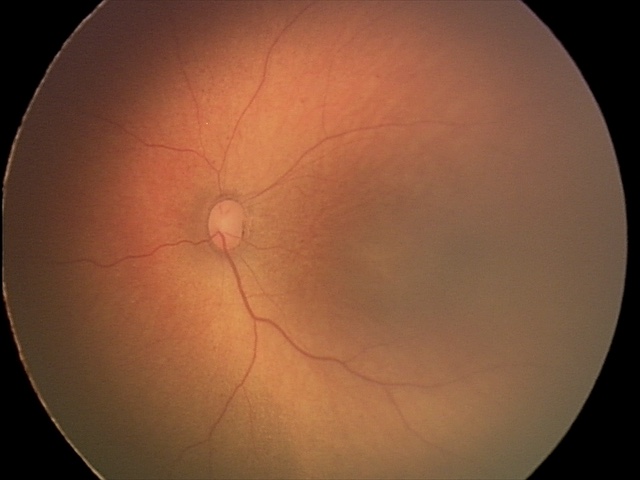
NormalPlus
  • i-ROP severity scale: retinal image 1 of 9
  • i-ROP severity scale: retinal image 2 of 9
  • i-ROP severity scale: retinal image 3 of 9
  • i-ROP severity scale: retinal image 4 of 9
  • i-ROP severity scale: retinal image 5 of 9
  • i-ROP severity scale: retinal image 6 of 9
  • i-ROP severity scale: retinal image 7 of 9
  • i-ROP severity scale: retinal image 8 of 9
  • i-ROP severity scale: retinal image 9 of 9