Zone

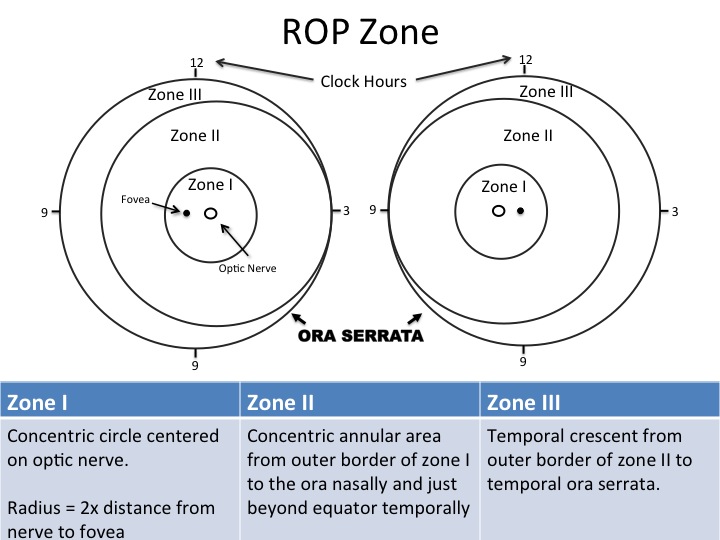
  • ROP zone diagram: Zone I, Zone II and Zone III, with clock hours and the ora serrata
    Zone overview

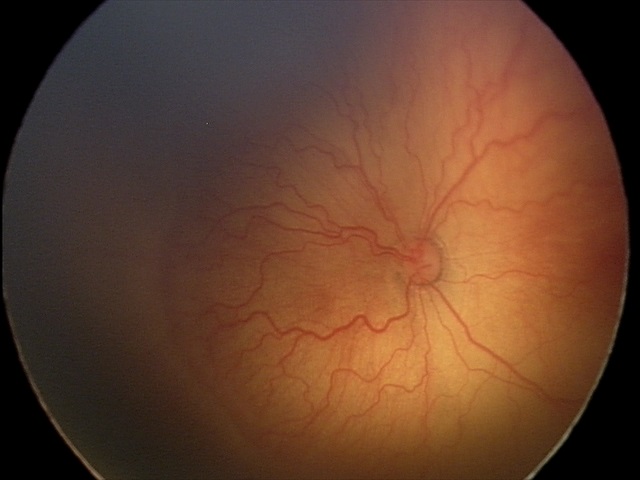
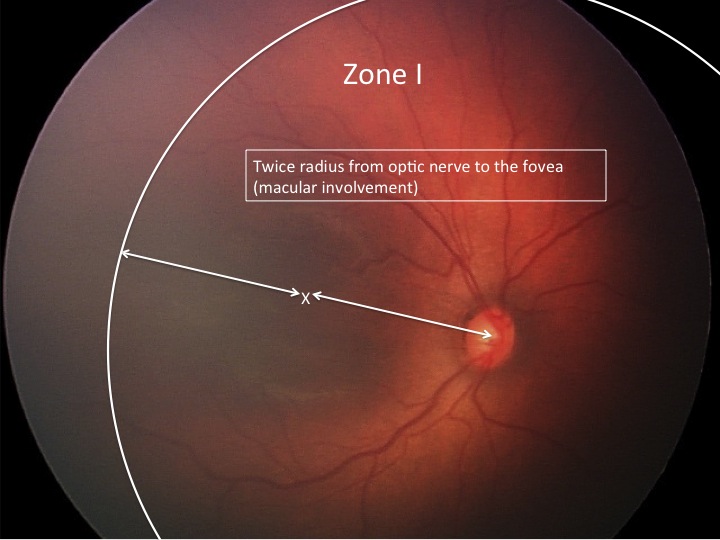
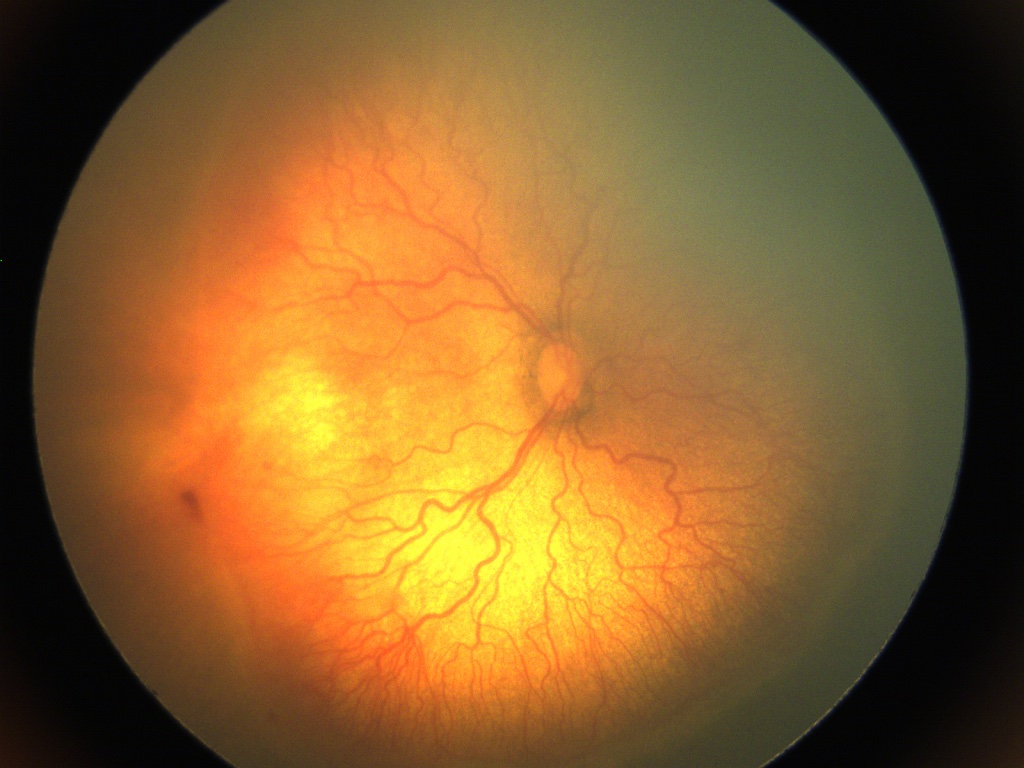
Examples of Zone I

  • Zone I: example retinal image
    Example
  • Zone I: annotated retinal image
    Annotated

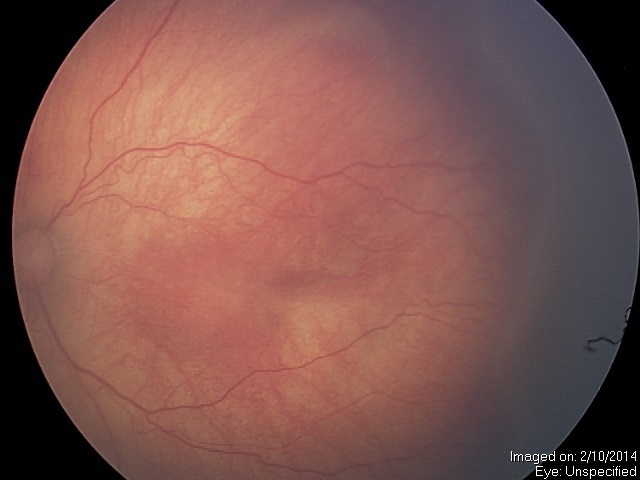
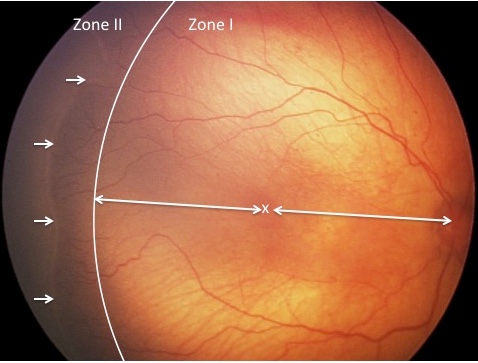
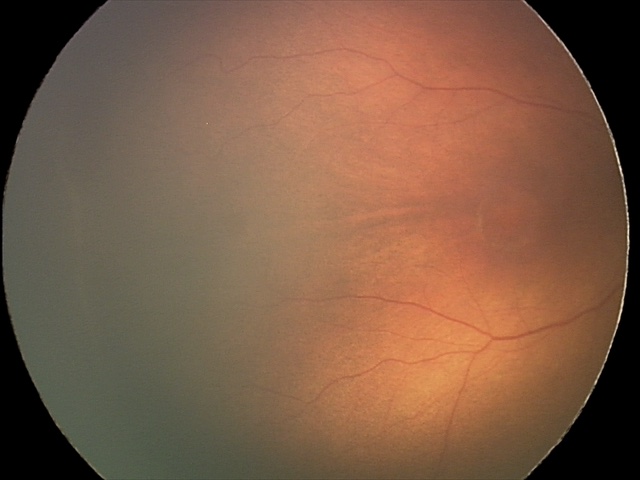
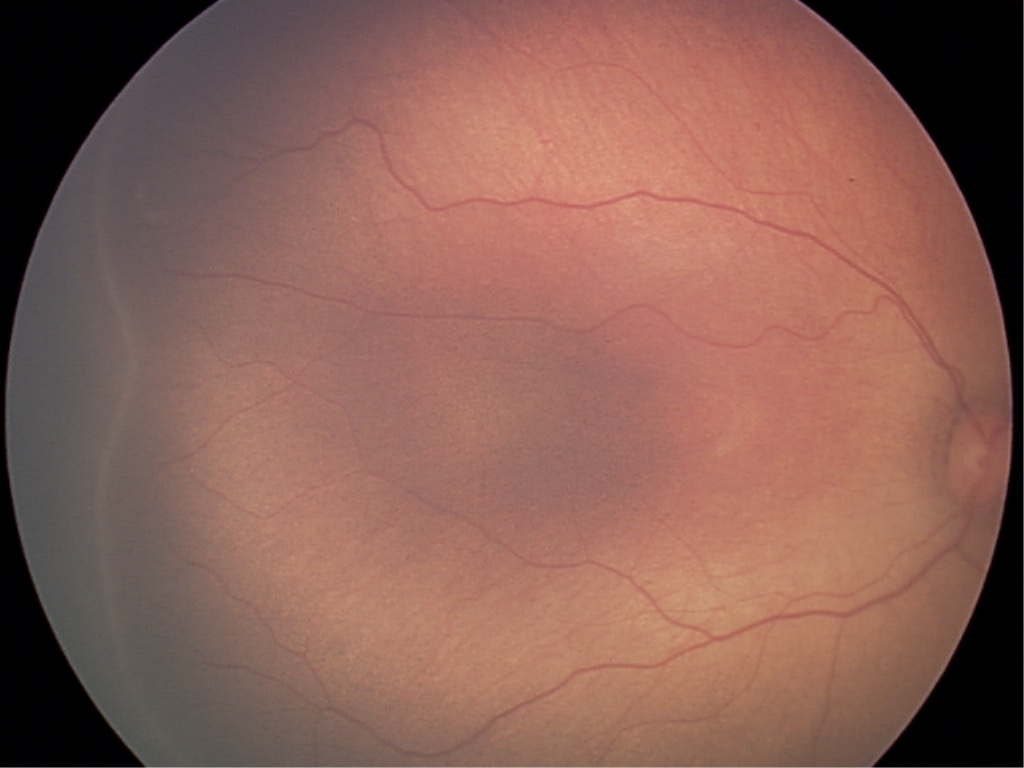
Examples of Zone II

  • Zone II: example retinal image
    Example
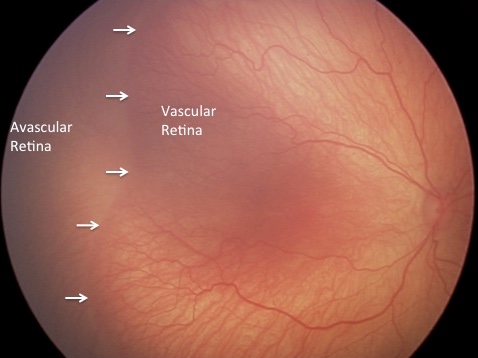
  • Zone II: annotated retinal image
    Annotated

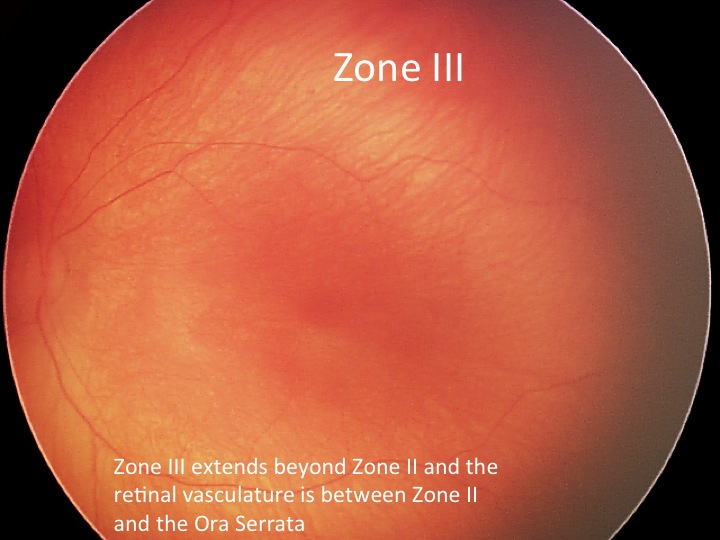
Examples of Zone III

  • Zone III: annotated retinal image
    Annotated

Stage

Examples of Stage 1

  • Stage 1: example retinal image
    Example
  • Stage 1: annotated retinal image
    Annotated

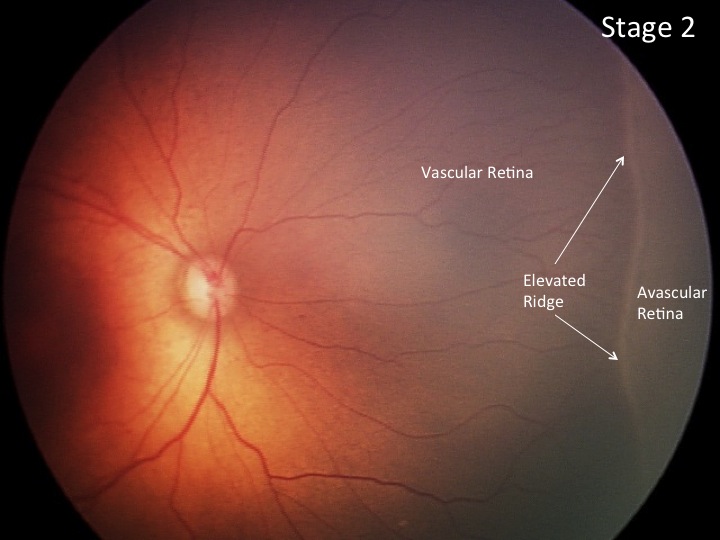
Examples of Stage 2

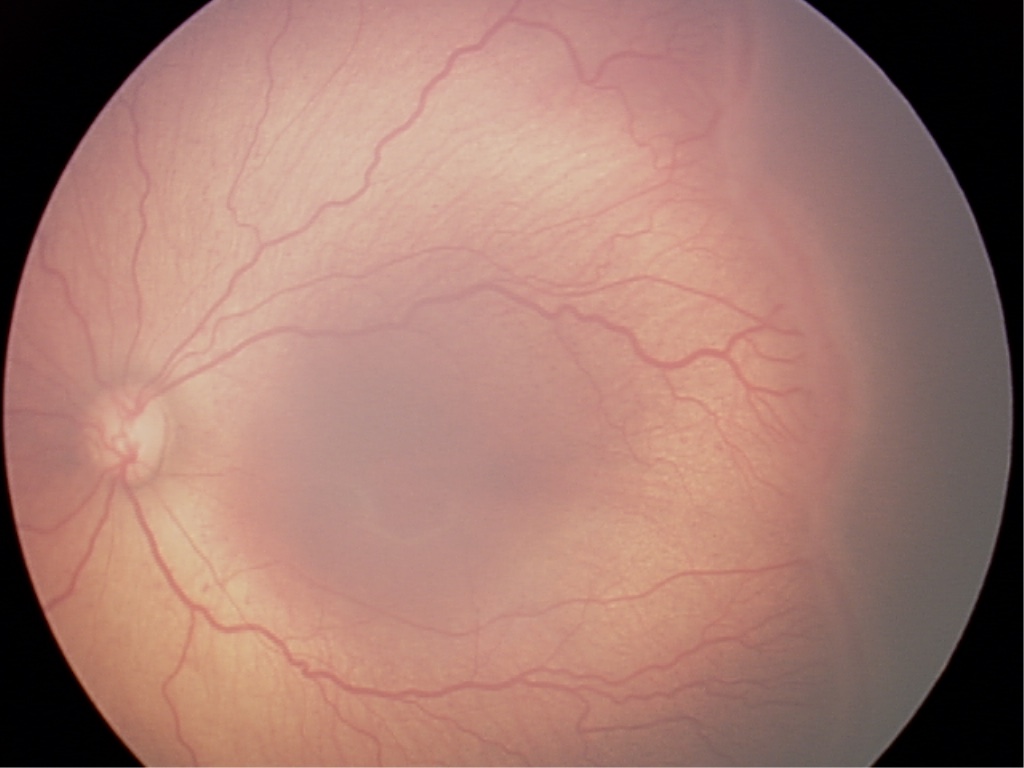
  • Stage 2: example retinal image
    Example
  • Stage 2: annotated retinal image
    Annotated

Examples of Stage 3

  • Stage 3: example retinal image
    Example
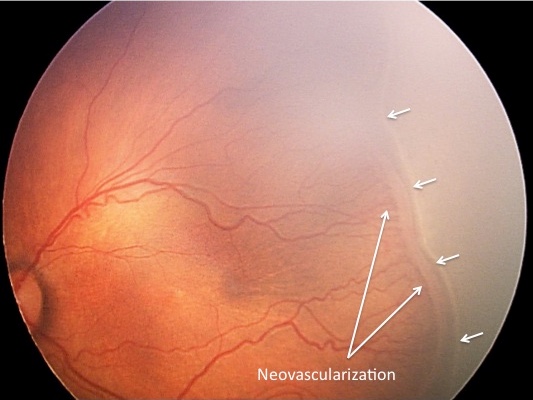
  • Stage 3: annotated retinal image
    Annotated

Examples of Stage 4

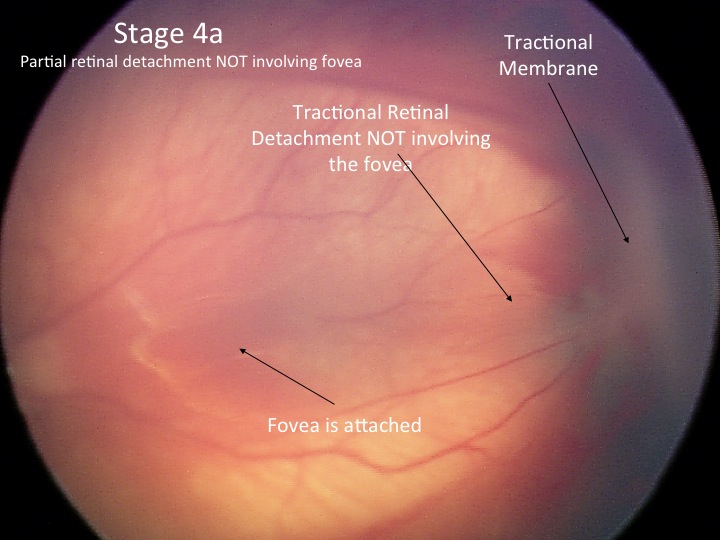
  • Stage 4a: annotated retinal image
    Stage 4a
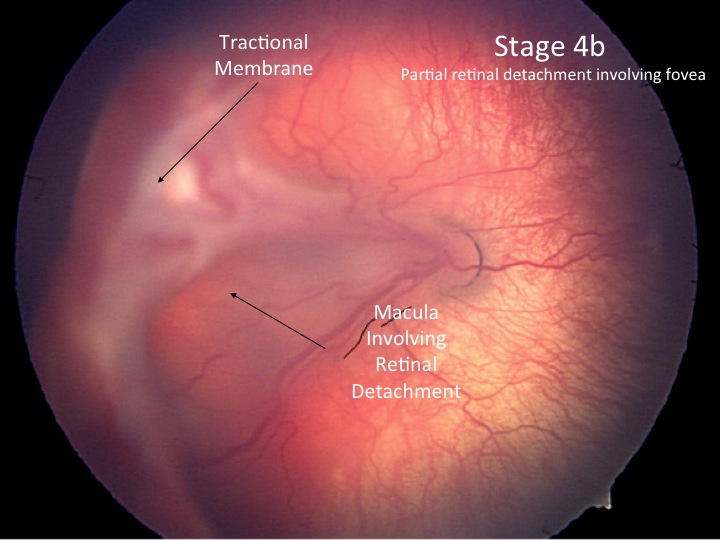
  • Stage 4b: annotated retinal image
    Stage 4b

Examples of Stage 5

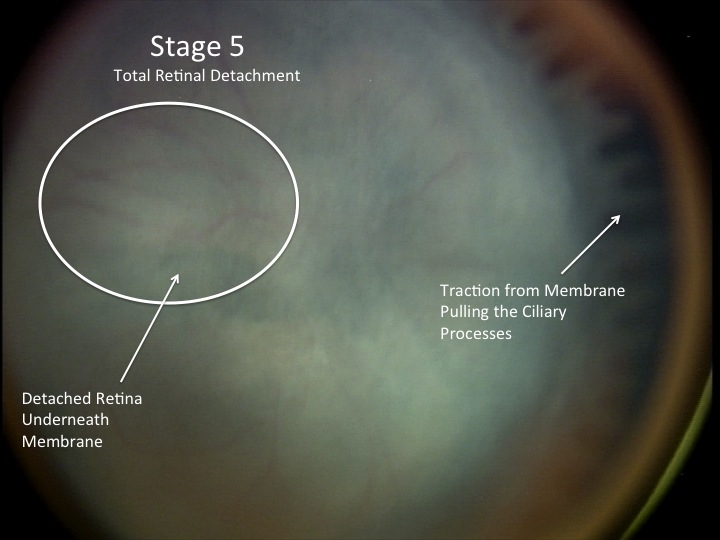
  • Stage 5: annotated retinal image
    Annotated

Plus

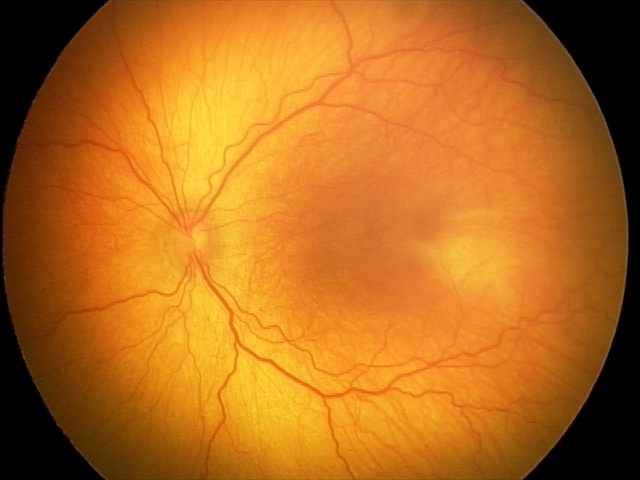
Examples of No Plus

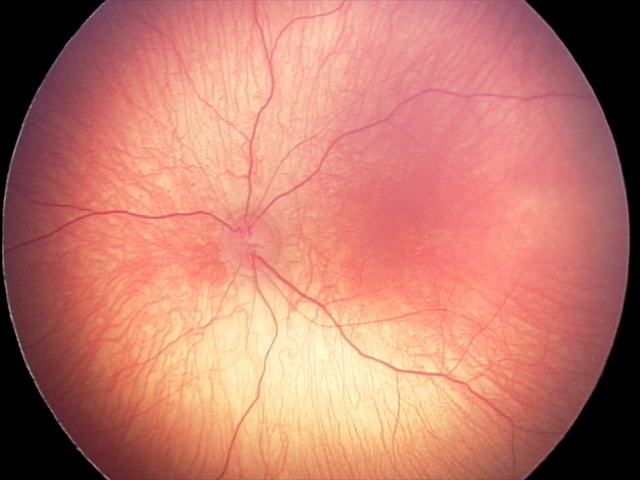
  • No plus disease: example retinal image A
    Example A
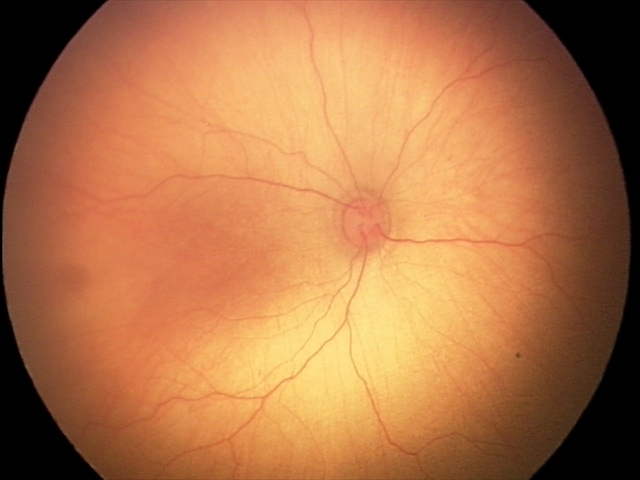
  • No plus disease: example retinal image B
    Example B

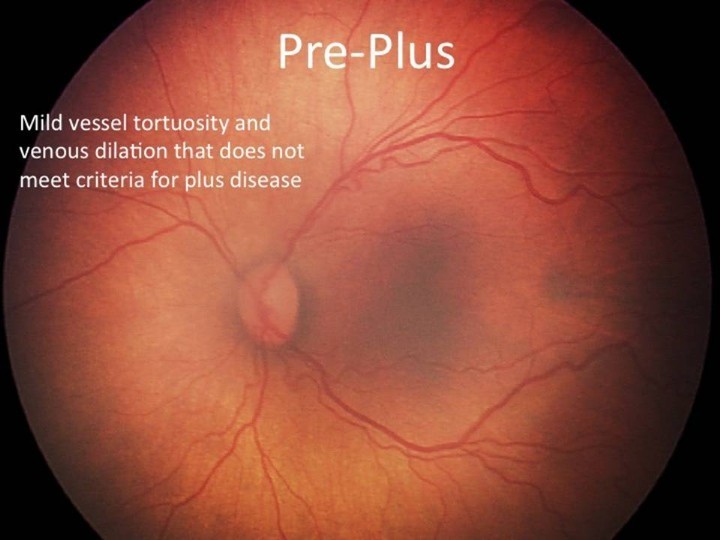
Examples of Pre-Plus

  • Pre-plus disease: example retinal image
    Example
  • Pre-plus disease: annotated retinal image
    Annotated

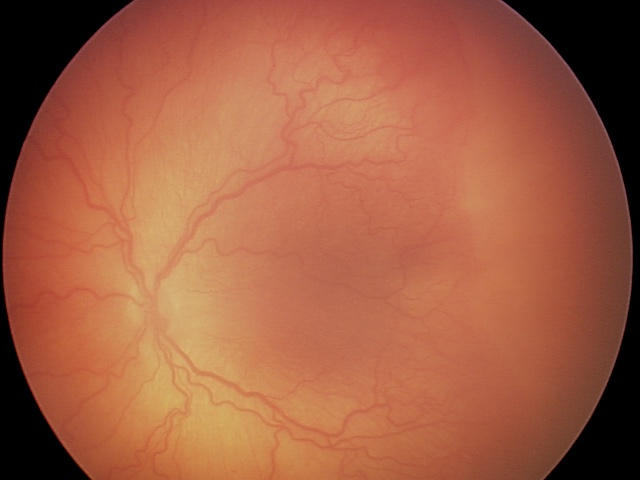
Examples of Plus

  • Plus disease: example retinal image
    Example
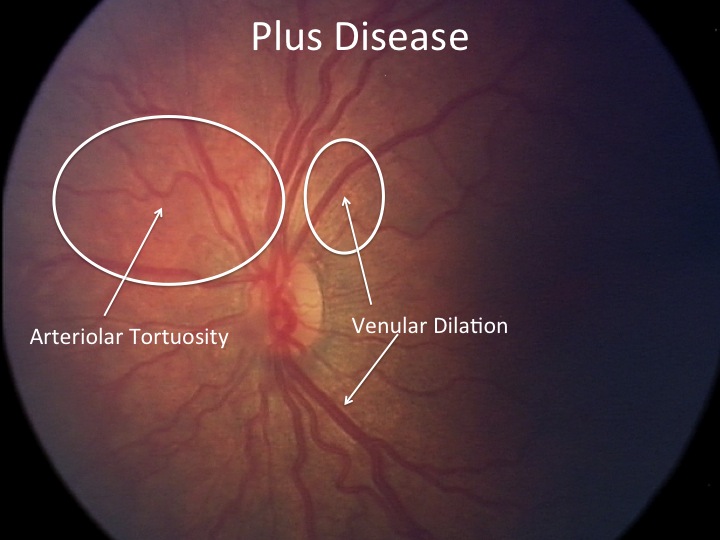
  • Plus disease: annotated retinal image
    Annotated

Examples of AP-ROP

  • AP-ROP: example retinal image
    Example
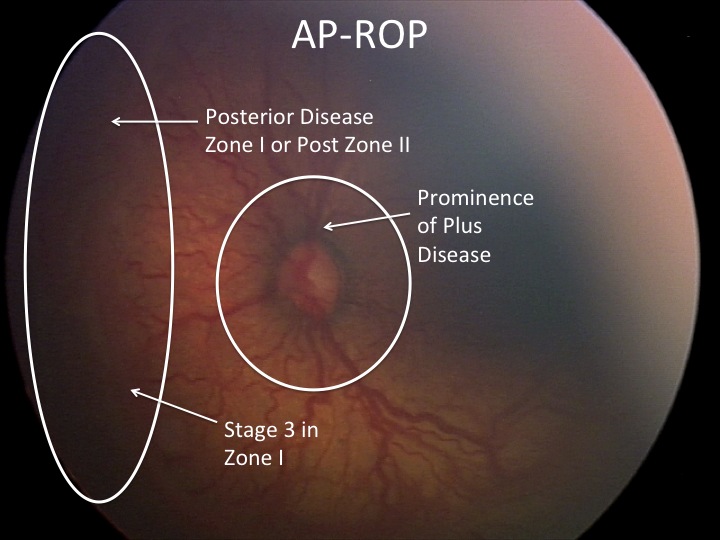
  • AP-ROP: annotated retinal image
    Annotated